Testing the Validity of the Ghost Box as a Tool for Paranormal Investigation.
Mitch
Silverstein1, Stephanie Bohn1,
Kenny Biddle2
1Nyack
Paranormal-
contact@nyackparanormal.com
http://nyackparanormal.com
2ParaInvestigator-
parainvestigator@comcast.net
February 21, 2015
ABSTRACT: The
Ghost Box is a widely used device for paranormal investigating. We question
the level of objectivity by those using this device. Respondents were sent a
one minute recording from a Shack Hack Ghost Box and asked to respond to a
questionnaire. We analyzed the results and explored the workings of these
devices. The findings tell us that the interpretation of results by those
who use this tool is very biased and subjective. The results collected in
the field should not be put forth as evidence of paranormal activity.
INTRODUCTION
As a modern and portable version of the Frank’s Box by Frank Sumption (developed in 2002 for spirit communication [1]), the Ghost Box (also known as a Spirit Box) has been the center of debate for many years among ghost hunters and paranormal investigators. It debuted in the market somewhere around 2006 through TV show exposure; several designs have been developed since. Basically it is a portable battery operated radio which has been altered to scan the spectrum of radio frequencies within the range capable of the unit’s specifications. Early versions were an easy “hack” and more recent versions have added features such as an adjustable sweep speed and built in recorder. All in all they all do the same thing it was originally designed for, receiving radio broadcasts.
We will be conducting a series of experiments and research projects covering many of the tools that the typical paranormal investigator relies on for results. Here we seek to test out the viability of the Ghost Box and report our interpretation of the findings. We believe that the level of bias in the interpretation of responses from the ghost box is high and subjective to the point that it cannot offer objective and useful data in an investigation.
METHOD
For this experiment we created a survey to seek feedback from an actual
recording made with a Ghost Box. The request for participants was published
on social media asking for help with a ghost box study. No details were
provided at the time. Ninety eight (98) respondents were sent a
questionnaire (Figure 1) to seek feedback from a one minute long Ghost Box
recording (Link:
http://nyackparanormal.com/GB/QuesAM.mp3 ). These respondents were
randomly separated into two groups based on order of response.
The recording was
made using a “Shack Hack” (Radio Shack Digital AM/FM Pocket Radio Catalog #
12-469: Figure 2) coupled with a digital voice recorder (RCA Model
VR5320R-A). The audio file was transferred to PC and converted to MP3 to
match the original raw file, no manipulation or noise reduction was used. A
one minute segment was captured for this experiment.
Group A would hear the one minute recording and Group B would hear the same
recording with an additional three seconds of audio at the beginning that
included the question: "What is your occupation?” There was no other
manipulation to the recording or difference between the two sample
recordings.
FIGURE 1- Survey Form
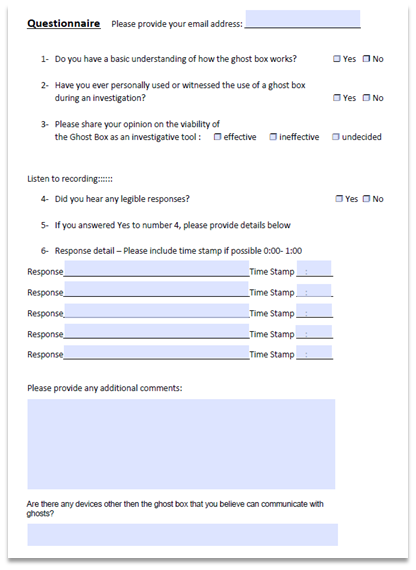
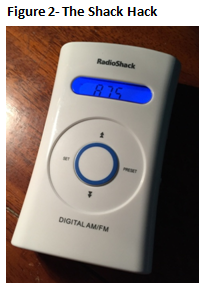
Photo: M. Silverstein
RESULTS
Group A had 19 completed responses out of 49 (39%) and group B had 17 responses out of 49 (35%).
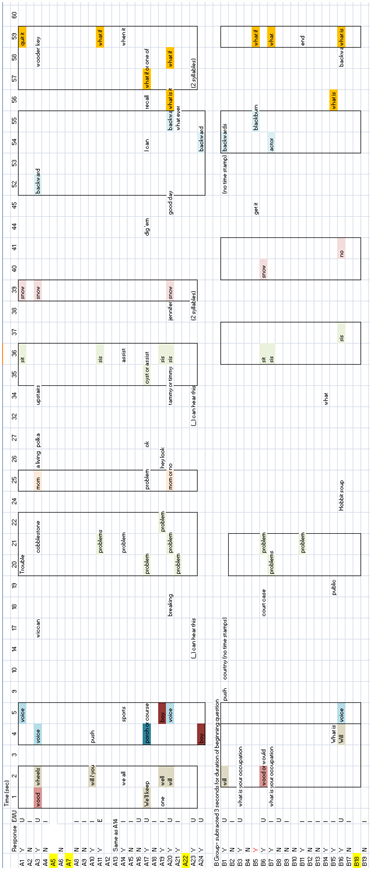
The results of the survey were compiled into a spreadsheet (see Appendix) with the perceived words mapped out to their time stamp along with the survey answers.
We found that there were consistent words and/or sounds across the respondents reporting results. Table 1 shows the words and/or sounds with two or more like responses located within 4 seconds of their timestamps.
TABLE 1- Words from multiple responses
Of all responders/36 Responders hearing words/18
1-4 sec will, we’ll, well, wheels (8/36=22%). 44%
4-5 voice, sports, porch (4/36=11%) 22%
20-22 problem, problems (9/36=25%) 50%
25 mom (2/36=6%) 12%
26-27 polka, OK, hey look (3/36=8%) 16%
35-37 cyst, sis or sit (10/36=28%} 56%
39-40 snow or no (5/36=14%) 28%
52-55 backward, Blackburn, actor (6/36=17%) 34%
56-59 What if, what is, when it, etc (8/36=22%) 44%
Of these responses we noted:
Group A- those noting a response (n=10): Mean 6.6 responses each were noted.
Group B- those noting a response (n=8): Mean 3.6 responses each were noted.
Statistical Analysis:
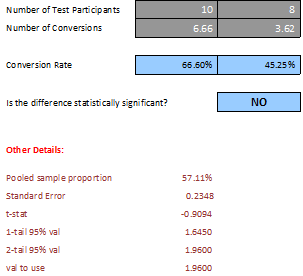
The mean number of responses from each group was run through a t-test [2] to see if the results are considered statistically significant. The average number of words heard for each group was put through the calculation (Table 2); Group A heard an average of almost twice as many words (174%) as Group B but the difference is not statistically significant solely because of the small sample size (as an exercise, we increased the total number of respondents yet kept the same ratio of words heard and the results were statistically significant).
Table 2-
Statistical calculator based on the T-test at 0.05 Level of Significance.
Testing for Statistical Significance in Controlled Experiments
TRENDS
Trend 1
Group A- # people reporting responses vs no
responses
10 out of 19
53%
Group B- # people reporting responses vs no
responses
9 out of 18
50%
We found this interesting that both groups are about even in value. These show the groups were well sorted by random distribution.
Trend 2
One participant deemed the Ghost Box as an effective tool for investigating=3%. 61% stated it is ineffective and 36% are undecided of the responses to this question (Table 3).
Table 3- Survey Responses
E/I/U= Effective, Ineffective, undecided
Group A E I U n= 19 (one (1) no response to this question) 18
1 10 7
Group B E I U n= 18 (three (3) with no response to this question) 15
0 10 5
Overall E I U n=37 (33 responses)
1 20 12
3% 61% 36%
DISCUSSION
Generally the use of the Ghost box in paranormal investigation is inherently subjective and the units are flawed in design.
We did see a trend that showed bias towards seeking a specific response based on the question asked of the “spirits.” The difference can be attributed to confirmation bias [3]. Group B that was posed the question would have been specifically listening for a response that would fit the question. They may not report words that did not fit the suspected answer besides the most obvious. This coincides with our hypothesis but the sample size is too small to lend statistical significance to these findings.
Only one
respondent stated the ghost box is considered an effective tool. 36% are
undecided as to the effectiveness of the ghost box as a tool and the rest,
more than half at 61%, stated it was ineffective. There seems to be little
confidence in this sampling that any results of value can be obtained.
Random Words
The divergence between some of the sets of
sound-alike words is interesting to note; it illustrates how responses may
be open to interpretation. Table 5 shows the sets of words and phrases that
were heard at the same time by multiple participants.
Table 5- Word Sets
1. Voice, sports, porch,
course, boy.
2. Wheels, will, we all, we'll keep, well, we'll.
3. Wiccan, breaking, Courtney, court case.
4. Trouble, problem, problems, cobblestone, hobbit soup.
5. Polka, OK, hey look.
6. Sit, assist, upstairs, sis, cyst.
7. Snow, no.
8. Backwards, whatever, blackburn, actor.
9. Wooden, what if, when
it, one of, what is.
Apart from the contents of Table 5, and even more
interesting, we were able to find four random words with no sound-alike
words whatsoever. Three of these words were heard during the recording
without the question (Group A); "Jennifer," "recall," and "key." The
fact that it was a name, Jennifer; a quasi-command, recall; and something
mysterious, like a key; was interesting because it was as if their
subconscious mind was trying to form something that might have meaning to
the investigator or to the spirit, possibly out of nothing.
One random word was heard during the recording
with the question (Group B), "What is your occupation?”, the word "end,"
which could be seen as pertaining to the state of one's employment. Hearing
the question resulted in a word that was possibly drawn from the imagination
and not hearing the question caused the mind to grasp for words of meaning
in general.
Additionally, in regards to all other responses, being influenced by the
question could cause a word that sounds like "backwards" to sound like
"actor." Many more responses were heard in general when the ears of the
participants were not specifically listening for the answer to a question.
The Radio
Many words did
come out clearly from the recording, likely a strong radio broadcast signal.
Also, several were two syllables showing that even a quick scan allows many
full words to be heard. We were curious as to how multiple words or phrases
have been reported from the use of these instruments so we also tested what
we call the frequency overlap, where a broadcast station is strong enough,
and the receiver is of the level of quality, to pick up the same broadcast
on the adjoining frequencies both lower and higher on the dial.
Scan Test
A manual scan one station at a time was done with the Shack Hack and the
very popular P-SB7 (Table 4). For the Shack Hack it was noted that the FM
station at 107.1 was also coming through rather clear at 106.9 and 107.3.
Due to strict broadcasting regulations we can assume it is the nature of the
radio tuner possibly coupled with atmospheric conditions that may cause
this. The target frequencies were typically stronger than the cohorts. More
stations with the same effect were found at approximately FM MHz:
90.5-90.7-90.9; 92.7-92.9; 94.1-94.3-94.5; 96.5-96.7-96.9; 97.1-97.3;
98.1-98.3-98.5; 99.5-99.7; 100.5-100.7-100.9; 106.3-106.5
AM KHz: 540-550;
570-580; 660-670-680; 770-780; 880-890; 970-980; 1010-1020; 1050-1060;
1130-1140; 1220-1230-1240; 1550-1560-1570
Figure 3- The P-SB7
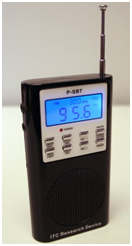
Photo: ghoststop.com
With the P-SB7, there was no noticeable overlap
along the AM dial, however, with FM, every station broadcast received
overlapped with the frequency immediately before & after the designated
frequency: 88.5, 89.3, 89.5, 89.7, 90.1, 90.5, 90.9, 91.7, 92.5, 93.3,
93.7, 94.1, 94.5, 95.7, 96.5, 96.9, 97.1, 97.5, 98.1, 98.9, 99.5, 100.3,
100.7, 101.1, 101.5, 102.1, 102.5, 102.9, 103.3, 103.9, 104.5, 105.3, 106.1,
106.9, 107.9
The stronger signals came in on either side of the target frequency almost
as clear as the target frequency, easily allowing several syllables and
multiple words to be heard at times, depending on the "Sweep Rate" setting.
Table 4- The description of the popular P-SB7
P-SB7 "ITC Research Device" (as printed on the device)
Eight buttons are provided on the front;
Sweep Rate - Allows the speed to which the device sweeps/scans through frequencies to be adjusted. Sweep rates of 100 ms to 350 ms are available for FM, and 200 ms to 500 ms are available for AM. Both adjust in 50 ms increments.
Back Light - Provides a blue backlight for the LCD screen.
Sweep FWD - Starts the device sweeping through frequencies from lowest to highest. Also allows user to cycle through frequencies manually.
Sweep REV
- Starts the devices sweeping through frequencies from highest to lowest.
Also allows user to cycle through frequencies manually.
Vol. "+" - Increases volume (Level 30)
Vol. "-" - Decreases volume
AM/FM - Switches device between receiving AM (KHz) and FM (MHz) frequencies. Available AM frequencies are between 530 KHz and 1710 KHz (119 frequencies). Available FM frequencies are between 76.0 MHz and 108.0 MHz (311 frequencies).
The frequency overlap effectively increases the exposure of any of these radio stations to the scan process.
We also tested this with an unmodified Radio Shack Multi-band Radio Catalog # 20-230. FM frequencies showed much of the same overlapping of frequencies: 90.5-90.7-90.9; 94.1-94.3-94.5; 96.5-96.7-96.9; 97.1-97.3; 98.1-98.3-98.5; 106.3-106.5, however, none of the AM band showed this characteristic, similar to the P-SB7. It does seem this is much a function of the quality of the tuner in the radio. The different models of the ghost box should be checked for these patterns. It seems the ‘cheaper’ radios may have less frequency accuracy. This would expose the Ghost Box listener to a much longer listen at broadcast frequencies increasing the chance of catching longer, clearer words or phrases.
Although using the AM band may mitigate frequency overlap typical of the FM band, AM broadcasts are generally more news and talk shows which increase the chances of catching a spoken word. Both bands have their disadvantages with little or no advantage over the other especially if the unit only provides single band access. These units should have a way to record the frequency at which these words are perceived so one can go back to those stations and review the context of their broadcast.
Coupled with the findings from the frequency overlap, the speed of the scan can make a difference in the interpretation of responses. The newest models of the Ghost Box claim the scan speed can be set to a faster rate than words can be formed or spoken.
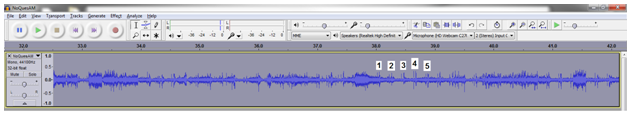
Scan Speed
According to our findings, the Shack Hack scans at 5 frequencies per second or 200ms (Figure 4) and two syllable words were easily understood. Either the word(s) spanned 200ms (1/5 of a second) or it spanned two or more adjoining frequencies (up to 600ms or more).
Figure 4- Audio file showing peaks designating the scan rate for the Shack Hack
From Scientific
American- “When we speak rapidly we are verbalizing at about six syllables
per second. That hyperactive radio announcer spewing fine print at the end
of a commercial jabbers at 10 syllables per second, the absolute limit of
comprehension for sighted people.” Blind people have been found in the same
study to be able to comprehend up to 19 syllables/second.[4]
From Wiki: Speakers vary their speed of speaking according to
contextual and physical factors. A typical speaking rate for English is 4
syllables per second,[5] but in different emotional or social
contexts the rate may vary, one study reporting a range between 3.3 and 5.9
syl/sec,[6] Another study found significant differences in
speaking rate between story-telling and taking part in an interview.[7]
These studies and measures show there is a strong
possibility and supporting evidence that single and multiple syllables could
be heard from the scanning process. Even the faster scanning units
available (down to 50ms) can capture discernible syllables and with
frequency overlap, coincidence of context to neighboring broadcasts and a
biased ear, words and phrases will be heard. Those investigators claiming
longer sentences or phrases must scrutinize the source of their findings in
great detail.
Radio Broadcasts
We have also heard many investigators state that there are little or no
radio signals in the area they are investigating so any response from the
ghost box must be a spirit. In most cases the investigation takes place at
night. AM frequencies travel much greater distances due to the bouncing off
of the ionosphere in the evening and night time hours. This has led to
stricter standards for radio broadcasters with powerful transmitters to
reduce power during these hours. There are still distant signals that travel
farther during the high point of use for the ghost box. [8] FM
signals are effectively stronger and lower to the ground and carry better
through buildings. Due to the nature of the wave it holds up much better
than AM against noise and interference making words come through more
clearly. As an unscientific attempt to see how strong radio signals are at
night, we placed the ghost box inside a totally stainless steel dishwasher
in an attempt to reduce the reception on the radio but we still picked up
most stations with little or no reduction in reception quality.
CONCLUSION
Although a larger sampling of participants would strengthen the support of our hypothesis, we conclude there is enough information to state the Ghost Box is not a proper research tool for paranormal investigating due to the strong bias involved in the use and interpretation of the responses in the field. The intended use of the Ghost Box lends little or no control over the many inherent variables and it solely relies on subjective opinions as to what results are considered valid. The units are flawed in the sense that it will generate syllables by default which guarantees a user with belief in the device will interpret it as a spirit response. We do not present this research to suggest to people what to believe in, we merely support the facts and evidence that perceived results from the ghost box should remain a personal experience and should not be presented as supporting evidence of paranormal activity nor be included in any scientific methodology. Those presenting evidence based on Ghost Box recordings will bear the burden of proof that their findings support their beliefs.
REFERENCES
1. http://www.huffingtonpost.com/aaron-sagers/inventor-of-franks-box-gh_b_5689238.html
2. Statistical Significance Calculator By Rags Srinivasan
3. http://en.wikipedia.org/wiki/Confirmation_bias
4. http://www.scientificamerican.com/article/why-can-some-blind-people-process/
5. Cruttenden, A. (2014). Gimson's Pronunciation of English. Routledge. p. 54.
6. Arnfield, S.; Roach, Setter, Greasley and Horton (1995). "Emotional stress and speech tempo variability". Proceedings of the ESCA/NATO Workshop on Speech Under Stress: 13–15.
7. Kowal, S.; Wiese and O'Donnell (1983). "The use of time in storytelling". Language and Speech 26.4: 377–392.
3.
APPENDIX- Distribution of responses by
responder.