The Nyack Method of EVP Recording (NyMER)- Quadraphonic Recording of EVP Sessions for the Purpose of Determining the Location of Origin of Captured EVP’s.- First Experiment
Mitch Silverstein1,
Kevin Silverstein1
1Nyack
Paranormal- Nyack, NY
March 22, 2010
Abstract:
EVPs (Electronic Voice Phenomenon) appears to be the most common form of data collected at paranormal investigations. Nyack Paranormal has designed a system where EVP sessions are recorded through four channels simultaneously; Nyack Method of EVP Recording (NyMER). Amplified microphones were evenly spaced in a square within the area to be recorded. The microphones were calibrated with a constant tone in the center of the room. Standard EVP sessions were conducted as the four channels, perfectly synchronized, were recorded to a laptop computer. If audio was found that was of a unique origin, an analysis of the sound was performed. The wave form peaks were measured and compared at the exact same point on the recording time line. The quantified data was processed with software specifically written for the experiment. In one session, three instances of unique audio were captured. In two of the instances the sound was heard live by the participants and the software generally located it to the point in the room where it was heard. The third instance is a possible EVP which was located close to the point in the room where an investigator was standing. This may possibly show that the EVP communication was directed specifically to an individual not only as an intelligent response but also by location as being “in your face”.
Introduction
Electronic Voice Phenomenon- Many claim they are caused by natural events, many claim they are paranormal and communications from the spirit world. Apply basic statistics and throw these extremes onto a Bell Curve and we have most occurrences then falling somewhere in between. Fascinating thought…
No doubt we are investigators and/or researchers because we have the belief that many EVPs can not be explained away by natural or man made causes. We all seek the truth. We may have those EVPs that have some doubt; we know we haven’t staged the recordings, with careful investigating we also know that we haven’t been set up or captured human contamination. So what is happening? Where is it coming from?
We will not claim they are spirits, although some EVP’s captured certainly seem appropriately spiritual. Are EVP's stray local radio signals? I have seen very limited unscientific data where a digital audio recorder can pick up sub sonic radio signals without actually being a receiver. Is it possible? Maybe, under extreme conditions. Like most things, however, we will need to see that ourselves. Are we picking up radio signals from a distance bouncing around the atmosphere and landing cleanly on our microphones? Not likely that a simple voice recorder would be so attuned to those frequencies without being a complicated receiver. Are there instances of audio pareidolia? Definitely there are many instances, especially with white noise, but not all the time. Is there another dimension imprinting communications on to our electronics? Sounds far fetched but this is a fairly common belief among paranormal enthusiasts. Are we crossing a historical path of space and time? Please suggest an experiment to test that! Do EVP’s come from all around us, from the air, or is it specific to a point of origin? We will attempt to test this.
Our objective is to find out if EVP’s come from a specific point in a room or if it comes from all around us; fills the air. We also can determine if it imprints directly on the electronics.
Materials
The set-up was constructed using mostly easily obtainable and affordable equipment. We call this the Nyack Method of EVP Recording or NyMER (Figure 4).
The microphones are amplified CCTV units, model W-mp100 that operate on 6-12V DC and have a frequency response of 100-5500Hz (voice range). These were mounted on tripods with a custom made attachment. The microphones were connected to the system using Siamese audio/power cables and the proper adapters (Figure 1).
The microphones were connected to a custom home made gain control constructed from four potentiometers and proper connectors in a project box. All parts available at the local electronics shop (Figure 2).
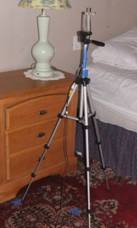
Figure
1. The microphone mounted on a tripod. Note: blue tape was used to mark
plumb center on the floor.
The USB interface from the microphones to the laptop was the MAYA44 USB by ESI. This unit has four channels in and four channels out and records all four channels simultaneously with the proper software (Figure 2). A typical mixing board has only stereo (2) outputs and would not have been suitable.
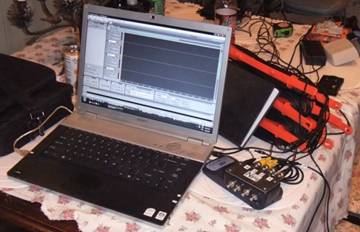
Figure
2. The USB interface and gain control connected to the laptop.
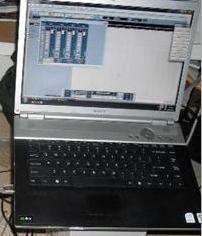
The Sony laptop computer had Cubase LE software installed which came bundled with the MAYA44 for calibration; Adobe Audition 3.0 for recording; SpinarTM proprietary software by Jai Ragoo, NY as the location tool. Spinar was tested against a sound model created by recording a tone at 100 points in a room and against an absolute model created by a virtual measure of sound logarithmically calculated for distance away from a microphone. The software was validated to a 4.4% error in a room with limited audio obstacles. Spinar allows the input of the dB values for each microphone, adjustment of sensitivity for when dB volumes are very low or at extreme ranges, the size in feet of one side of the grid being tested, an option to display the circles representing the distance of the sounds and an option to turn on and off the grid (Figure 3).
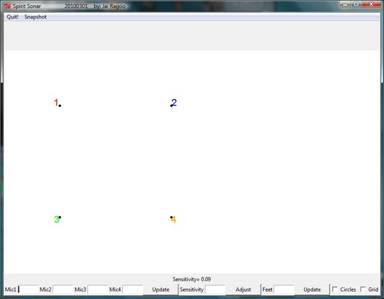
Figure
3.The Spinar screen.
All were connected to 110V power but via a multi-plug surge suppressor. The whole system can function on laptop battery power and 9V battery adapters for the microphones (Figure 4).
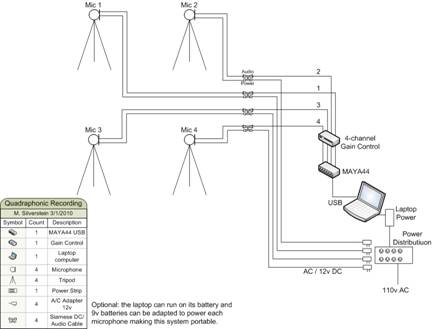
Figure
4. Schematic of the NyMER equipment.
The tone generator used is the Korg Chromatic Tuner CA-30. We also had pure white noise recorded on a voice recorder if needed.
Method
A room or area was chosen that would minimize echo and artifacts. The shape of the room and size was not critical as the system is scalable, however it should not be too small as to have the microphones too close together. We chose the Gentleman’ Quarters at the Shanley Hotel in Napanoch, NY for the experiment.
The microphones were set on their tripods and placed at the corners of a ten foot square. Measurements between each microphone along the perimeter of the square were repeated until they were evenly spaced. Diagonal measurements were taken to confirm the squared and to locate the center of the square. The square was placed roughly in the center of the room. Each tripod was marked with tape on the floor, finding the center with a plumb-bob.
All cables were connected and a basic operational test was preformed. The system was then calibrated by placing the tone generator on a tripod in the center of the room and checking the levels of each microphone simultaneously using the Cubase LE mixer function (Figure 5).
Figure
5. Cubase LE mixer used to calibrate microphone levels.
The gain control for each channel was adjusted until the level for each microphone was within 3% of each other (Figure 6).
|
Calibration |
|||
|
Mic 1 |
Mic 2 |
Mic 3 |
Mic 4 |
|
25.6 |
25.1 |
25.8 |
25.9 |
|
Figure 6- Microphone Calibration- values in Peak dB |
|||
A test of the calibration was performed by having an impartial volunteer enter the room and speak from an unknown point in the room. Upon review it was determined that the system located the proper point on three tests within a two foot distance. This is an acceptable level of error equal to 4 square feet out of 100 square feet.
Experienced investigators in groups of four to five performed standard EVP sessions that lasted approximately fifteen minutes each. Three groups rotated through the room for three sessions total. The groups were allowed to use their own investigation equipment as long as it didn’t disrupt the recording process.
The room used has only one entrance through a hallway with four rooms on the level above with the only access through the same hallway. No one was allowed upstairs during the experiment and traffic was easily controlled in this area allowing almost no human contamination to the recording sessions (Figure 7).
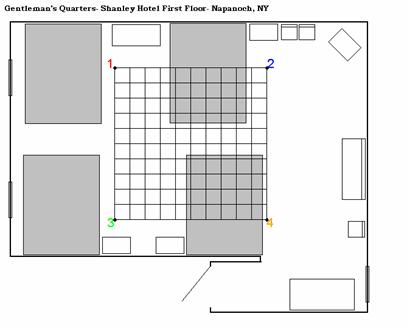
Figure7. Showing the four microphone locations (1, 2, 3 and 4) and the 10’ x
10’ grid within the Gentleman’s Quarters.
Recording, playback and dB measure was accomplished using Adobe Audition (Figure 8).
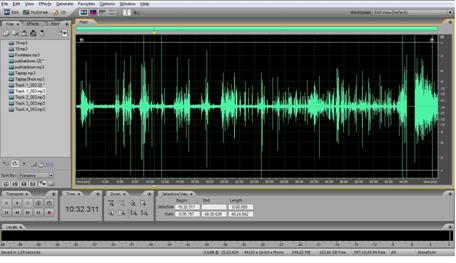
Figure
8. Adobe Audition- measuring the dB peak.
Results
The first two sessions did not produce any analyzable data. It is possible that it was too early as the sessions started at 8:10 PM. Further review is pending. We will review the results from the third session which has three items of interest.
1- The session began at approximately 10:20 PM. Our recorder was running throughout the break between sessions and into this session so our time stamp is approximately fourteen minutes later than the groups own original recordings. However, there were no problems synchronizing the recordings for review.
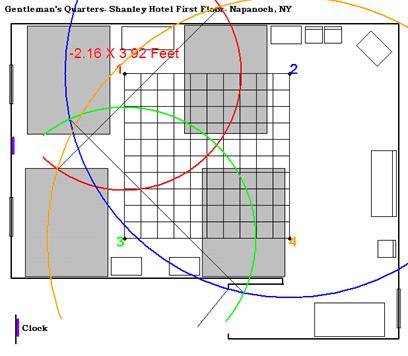
At ~27:33 of our recording, a low voice, almost a whisper can be heard saying “put that down”. Listen HERE. It barely registered dB peaks in the recording software. The analysis with the Spinar software showed the voice originate approximately where Chris M. was located, standing at the foot of one of the beds (Figure 9).
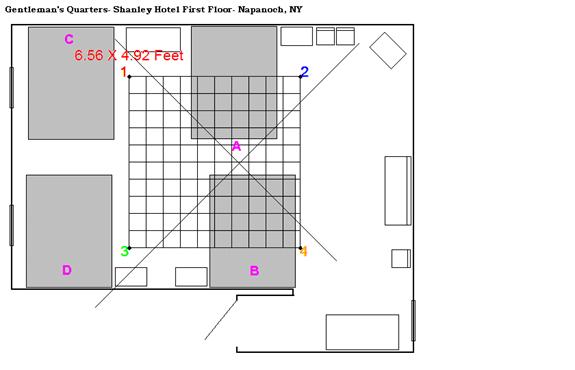
Figure
9. The location of voice saying “put that down”. A= Chris M; B= Paul S.; C=
Sandy B., D= Derek M. (T.S.P.). Values: Mic 1= -45.4 dB; Mic 2= -36.7 dB;
Mic 3= -40.6 dB; Mic 4= -41.5 dB.
Chris M. was using a device that projected a colored spot of light. It is possible someone in the room asked to put it down, but not likely as it is a useful instrument that they use on investigations. Voice spectrum analysis was reviewed using Pratt software. There is a resemblance between the voice captured Paul’s frequency pattern but not an exact match. This comparison is not conclusive but may lean towards a novel voice captured on the recording (Figure 10).
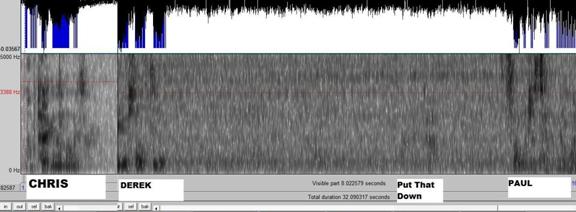
Figure
10. showing spectral analysis of voices. X-axis is frequency in Hz and the Y
axis is time. All show low tones, however, “put that down” shows similar
patterns to other voices in the room at a much lower volume.
The interesting point of capturing this
2- At 34.48 of our recording, a member of the group in session provided the usual “shave and a haircut” knock on the wall. It was proceeded with a response to which all in the room reacted. The group detected that it came from the far end of the room, possibly two taps on a glass fronted wall clock which was not running at the time. Listen to the recording HERE. Inspection of a video that was taken during the session by the group showed heads turning in the same direction of the wall with the clock. Spinar analysis confirmed the sounds originated generally from that end of the room (Figure 11).
Figure
11. The general location where the tap tap response was heard. This picture
shows the circles in the Spinar software that calculates the intercept
showing the general locations of the sounds based on dB measurements from
the Adobe Audition recording. Values: Mic 1= -23.6 dB; Mic 2= -45.3 dB; Mic
3= -26.5 dB; Mic 4= -48.9 dB.
The Spinar software did show the general location of the sounds. It did locate it central to the far wall and well outside our recording grid. When we lower the Sensitivity setting in Spinar it brings the location much closer to the wall and within our two foot expected error.
3- At approximately 38:28 of our recording there were a series of thumps captured. Upon careful review they appeared to sound like footsteps. The group responded as everyone heard them live in the room. Listen to the audio HERE.
At one point on the audio Derek states it sounds like it is coming from an area by his feet. The Spinar analysis shows just that. The sounds were coming from the area by the foot of the bed (Figure 12).
Figure 12. The footstep sounds originated in the area between the two beds.
Values: Mic 1= -21.2 dB; Mic 2= -39.7 dB; Mic 3= -25.3 dB; Mic 4= -46.1 dB.
Discussion
The quadraphonic recording rig performed very well. The quality of the recording was fine and the frequency response recorded was as expected in the voice range between 100 – 5000Hz. Set up was fairly easy. We did find that the first room we set up in was of an odd shape with a gabled ceiling. Calibration was difficult and we abandoned this room for a furnished and rectangular room. The calibration procedure there went smoothly.
Upon completion of each session, several participants reviewed their voice recorders for hits. The third session hits were reviewed on the quad recordings and all sounds captured on the voice recorders were also captured on the quad recorder although the quad microphones had a more limited frequency response.
As the hits were located on the quad recordings using Adobe Audition, each channel was reviewed for the sound and a higher peak was selected with the time stamp to the hundredth or even thousands of a second was noted. The exact measure on each channel at this point was entered into the Spinar screen.
The location was not precise. With the known sounds and sounds heard live, the accuracy was within approximately three feet relative to the 100 square foot area grid. This level of accuracy still has significant ramifications however. It can shed much insight into whether a sound comes from within the room being investigated. A standard recorder or stereo recorder can not provide this information. It can also help determine if the sound was of human origin by knowing the locations of the participants and locating the sounds around them. It can also determine whether a sound comes from well outside the grid and may be contamination from another room or outdoors.
The possible EVP mentioned above, “put it down”, may provide information that may have significant ramifications in EVP research. If we consider that the location found for this voice was basically right on top on an investigator, then this may show that the EVP communication was directed specifically to an individual not only as an intelligent response but also by being “in your face”!
Further experiments need to be conducted to collect more data. We need to consider the best dB peaks to measure and test if average peaks over a brief period of time has an advantage for accuracy. We will also consider alternate methods of calibration since we set the microphones at the highest equal volume; maybe a lower volume will provide better audio resolution. Although the simple amplified microphones performed well, we will try a higher range low impedance set of microphones. These microphones would require pre-amplification before connecting to the USB interface.
Further development of the Spinar Software by Jai Ragoo, NY will be done in the near future. We would like to incorporate the logarithmic function of sound/distance calculations as well as considerations to include the Z axis.
Finally, with more man power for
future experiments, we plan on having our own video recorders documenting
the process, stricter adherence to EVP session rules by having an associate
sit in on each session and run more sessions in total to collect much more
data and increase our chances of EVP hits.
Conclusion
The Nyack Method of EVP Recording (NyMER) performed well and shows a lot of promise discoveries in EVP research. With this first in a series of preliminary experiments completed, improvements in the process will help make steady progress.
Although we may end up routinely localizing the location of EVP’s we still need to determine their actual source. Localizing the sound is one step toward discovering the source.
We encourage other groups to try the Nyack Method of EVP Recording (NyMER). Equipment is not too expensive and we need to collect as much data as possible to advance this area of study.
The possibility of determining that an intelligent EVP could be not only be directed toward an individual verbally but also physically is astonishing and worth much more research and experimentation.
Acknowledgements
I wish to acknowledge the following experienced people that helped support and participate in this experiment (and hopefully more in the future). Without them this would still be just an idea on paper:
Jai R.; Nance R.; Jane M.; Robyn M.; Kenny B;. Deb L;. Mike L.; Julia P.; Jim J;. Rie S.; Mike A;. Mike H.; and T.S.P from Kentucky who collected the data in the third session- Chris M.; Derek M.; Paul S.; Sandy B. Last but by far not the least I thank Sal and Cindy N. of the Shanley Hotel for opening up their home for us to play.
References
References are not available as there are no scientific papers on this subject. Knowledge has been drawn from many unofficial sources.